
This article was originally written in Japanese on April 30, 2020.
Here at WebDINO Japan, we are working on Web VideoMark, a project that measures and analyzes the quality of experience (QoE) for Internet video streaming users, aiming to help make better use of limited network resources.
In reaction to the recent traffic hike amid the COVID-19 pandemic, we have developed a new analytics framework to utilize our data to look into the video-watching behaviors and settings of streaming service users while monitoring the network environment. We then have started to make our data and analysis available to the public.
In this post, we’ll share our early insights while analyzing the statistics in February and March. During this time, the Internet traffic has soared due to several factors, including remote work practices in some businesses, an event cancellation request by the government on February 26, and elementary school closures started on March 3.
We’ll later examine the subsequent period that includes the state of emergency declared on April 7 as well as the Golden Week, a Japanese prime holiday season in early May, once our statistics are ready.
Update: see new blog post: “How the Internet quality is affected during the state of emergency”
Executive summary
From our analysis of streaming service usage and network log data collected from Web VideoMark participants, we can tell:
- Watching hours: March saw more views on weekdays due to increased remote work and school closures, as well as on weekends by people in self-isolation.
- Service trends: There was a rapid increase in the views of certain content providers offering TV shows, dramas and animations, such as Amazon Prime Video, AbemaTV and TVer, rather than CGM-oriented streaming services like YouTube and Niconico.
- Network quality: Notable congestions were not observed from our analysis of the response times and throughputs on those streaming services. Meanwhile, sometimes responses became more prolonged, particularly on weekday nights. It requires regular monitoring as the problem may affect video conferences and other services.
- QoE on streaming services: We couldn’t find unfavorable impacts on the video streaming QoE. Average throughputs were maintained much higher than typical bitrates even during the prime time. The QoE had rather improved thanks to the changes in video-watching settings and behaviors — people are watching videos more on a larger monitor.
- YouTube’s default resolution change: they announced to make the standard quality (480p) the default resolution globally, starting with Europe and North America, aiming to ease the traffic boost. However, this measure is not yet in effect in Japan.
The significant increase in response times can lead to a degraded QoE due to poor synchronization in video conferences or remote desktop applications, so we may have to monitor the network more carefully using data from actual user settings.
View counts: Changes in watching behavior
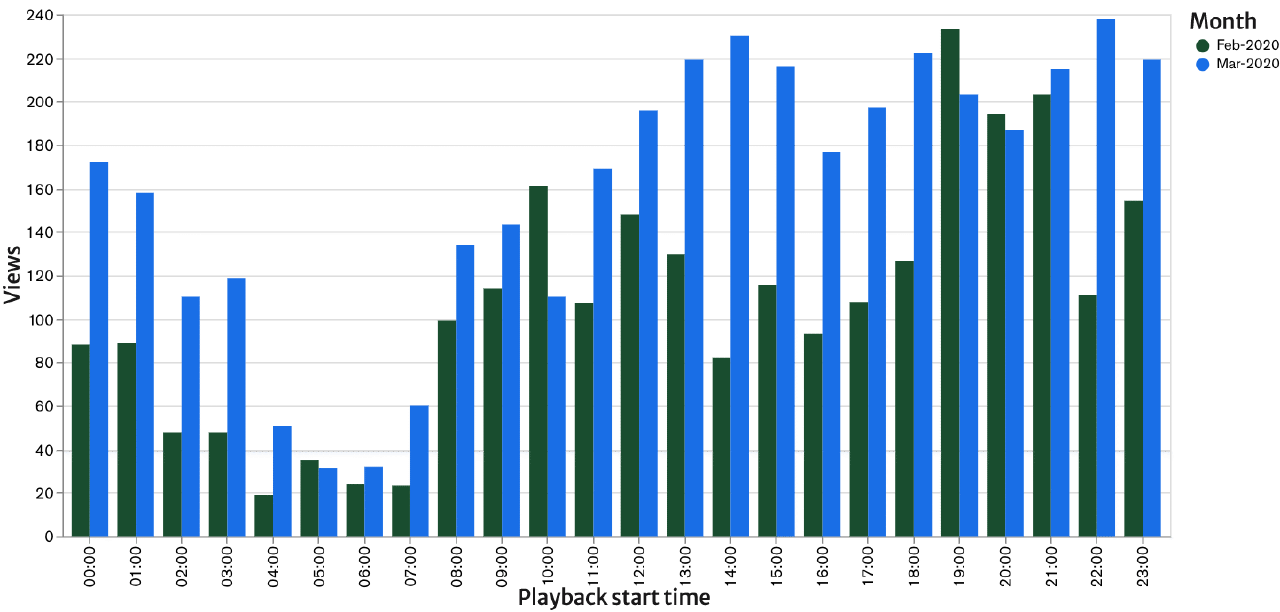
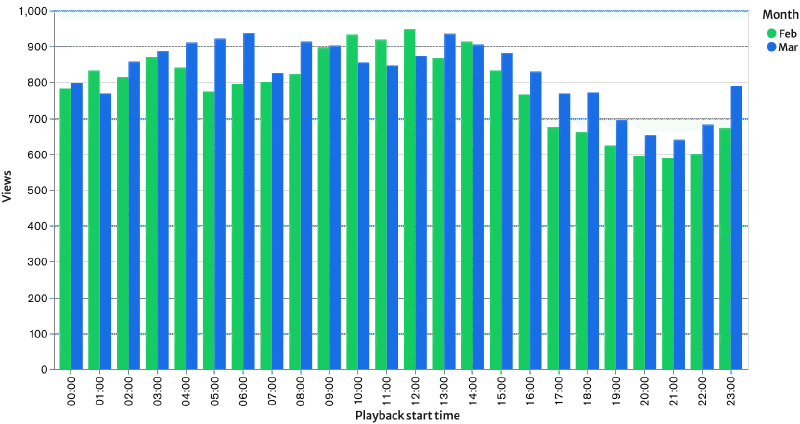
It’s well known that the usage trends of the Internet and video streaming services widely vary by day of week and hour. So, let’s see the changes in people’s watching behaviors by comparing the hourly video views in February and March on weekdays and weekends, respectively. Data sent from our automated measuring devices (bots) are excluded.
On weekdays, there’s an upward trend in daytime views. In February, people watched videos mainly in the evening and night. Contrarily in March, the daytime views neared the night peak hours, and late-night views also increased.
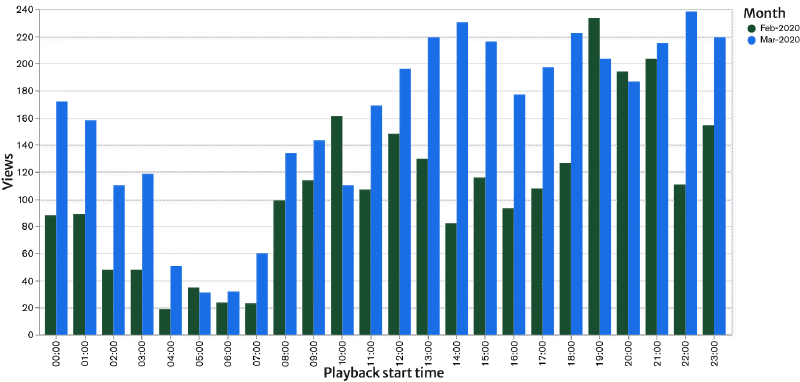
During weekends, daytime views had increased at different times of day. In February, many people watched in the late-night hours after 9 p.m., while March had viewers steadily between the late morning and 3 a.m.
Note: we can’t conclude the trends in per-user views from differences in the absolute measure values since each period had a different number of users, which had gradually increased. That’s why we are just comparing the distribution of view time slots.
It seems the increased weekday daytime views reflect the fact that people spent more time at home with a desktop computer after their office or school was closed. The increased weekend daytime views may be a result of people watching more videos during self-isolation.
We also compared the views on specific streaming services that we could have an adequate number of samples in February and March. As you see, the proportion of views of Amazon Prime Video, AbemaTV and TVer were higher than YouTube and Niconico:
| Service name | View sample growth | Growth rate compared to YouTube |
|---|---|---|
| Niconico | 1.27x | 0.92x |
| YouTube | 1.376x | 1.0x (benchmark) |
| Amazon Prime Video | 1.76x | 1.28x |
| AbemaTV | 2.32x | 1.68x |
| TVer | 4.11x | 2.98x |
Note: Since there have been changes in our user base, the view sample growth rates don’t necessarily represent the number of users or visits on each service. Also, the compared services’ samples were orders of magnitude less than YouTube, so the results indeed contain a substantial margin of error.*
Given the increased video streaming demand as a home online entertainment, people presumably favor content providers serving specific TV shows, dramas and animations over services featuring user-posted videos which are more suitable for zapping or distracted watching.
Response times and traffic speed: Changes in network congestion
OCN, the largest ISP in Japan, reported that their weekday daytime download traffic increased by 40% in early March, and 10% more afterward. IIJ, another major ISP, also said there was a daytime traffic hike in early March, that would be a 15% average daily increase.
According to OCN, their weekday daytime traffic neared weekend daytime, and their daytime peak also neared the evening peak, while the prime time between 9 and 11 p.m. saw a smaller increase of less than 10%.
Although several other reports also confirmed a network traffic spike, the Japanese government argues that they don’t see any significant issues in the national Internet infrastructure that keeps a certain margin. However, they only address the ISP-level whole traffic volume from a macro-perspective. Micro-perspective network quality issues affecting people, such as bottlenecks at fiber connecting nodes or PPPoE terminals, are outside of the scope.
While streaming, a web browser sequentially downloads video files encoded for a few seconds each from a CDN server, and play them smoothly in order. Web VideoMark measures the response time and throughput of each download, so we can analyze the trends and distributions to discover micro-perspective changes in the traffic quality that actual user experience when they connect to an actual services.
Hourly average throughputs
Now, we’ll discuss our hourly statistics based on per-view averages. By reviewing throughputs, which are file download speeds from a CDN server, we can detect any bandwidth tightness.
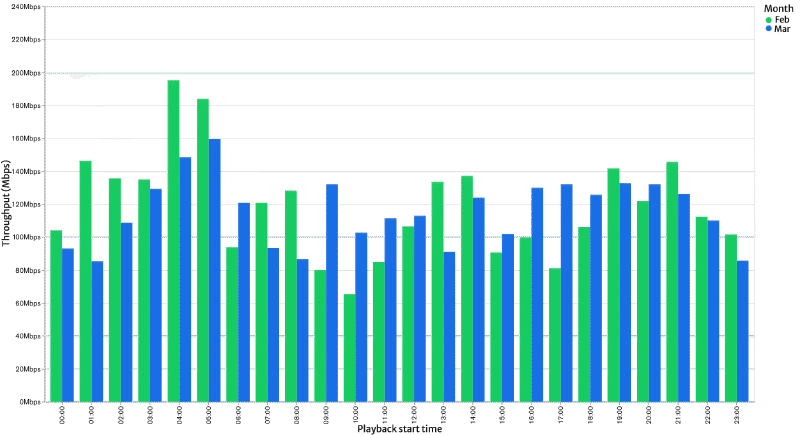
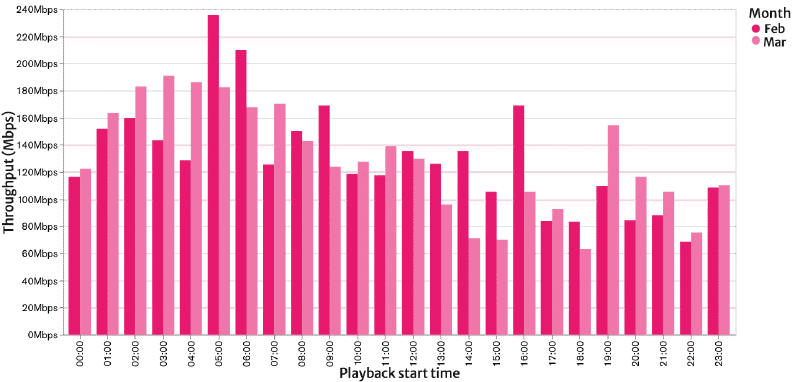
There are no significant differences both on weekdays and weekends. While downloads are relatively faster during the late-night and early morning hours on weekends, the network will be slower during the weekday daytime as well as the weekend afternoon and evening.
Either way, the average rate of over 60 Mbps is maintained, which means the bandwidth still has enough room for video streaming. In fact, we don’t recognize any decreased streaming QoE, as explained below.
Hourly average response times
We’ll look at the response times (RTT) next. An RTT will be longer if the server is busy, or there is any congestion on the user’s network route.
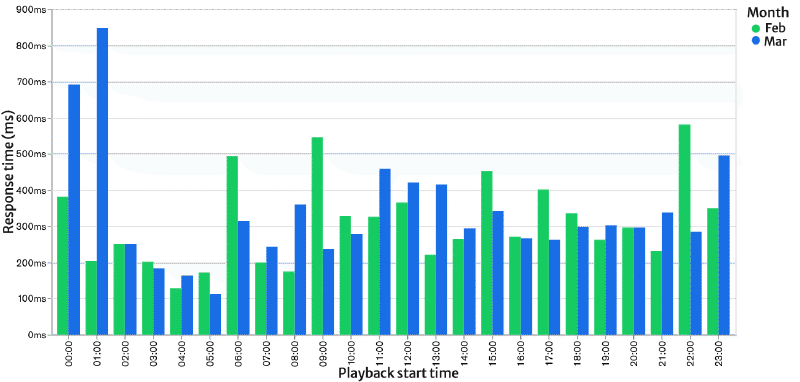
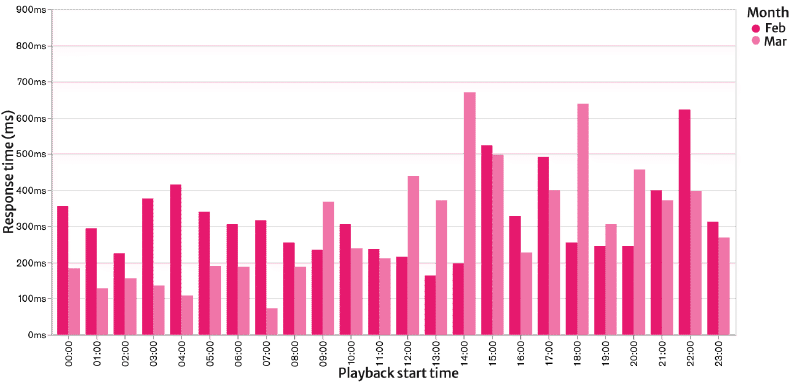
On weekdays, we don’t witness significant changes during the afternoon and evening hours. There is a remarkable change on weekends in March, where the response times doubled between midnight and 1 a.m. on weekdays, but the number would be less than 50% between midnight and 4 a.m. However, the difference is less than a second; it seems no hours are suffering from extreme congestions.
Daily server response times
We then created a chart exhibiting daily averages of several time slots with significant differences in the monthly average:
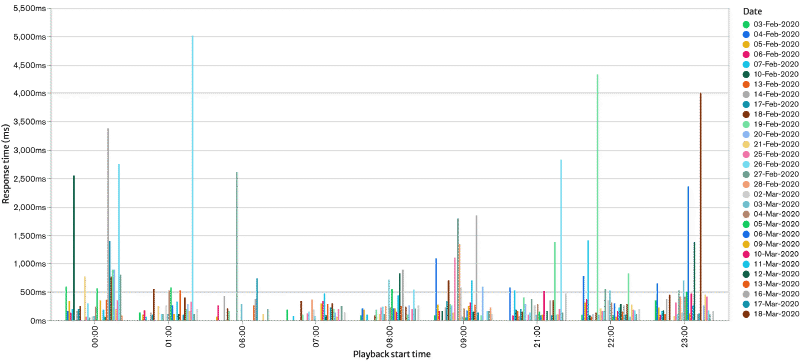
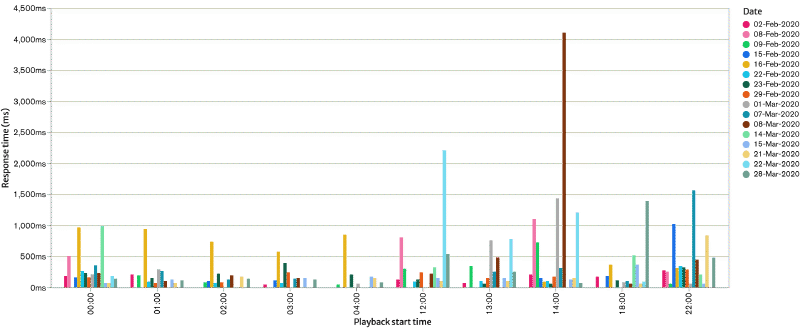
In daily and hourly cross tables, distributions vary widely due to the limited number of samples. This chart highlights longer response times during weekday late-night hours and weekend daytime, but most of the month-to-month differences are due to specific days with unusually long response times. We don’t observe any massive congestions that are enough to make responses slower for a couple of seconds continuously.
That said, prolonged responses would create a significant impact on the QoE of synchronic services. On video conferences or online courses (or even online games) abruptly demanded during the pandemic, any user on a network with longer response times could make the audio and video deliveries slower, preventing smooth communications among attendants. In contrast, the initial loading or seeking wait times would be only concerns of streaming services.
We’ll continue to focus on this kind of micro-perspective analysis.
Trends in video streaming service QoE
Compared to February, we witnessed a lower network traffic quality in March, such as longer response times and throughputs. How about the QoE on actual video streaming services?
Web VideoMark measures multiple parameters like bitrates, resolution and pausing times during each video playback, and determines the viewer’s QoE as a number from 1 (worst) to 5 (best). The following chart compares the QoE in February and March:
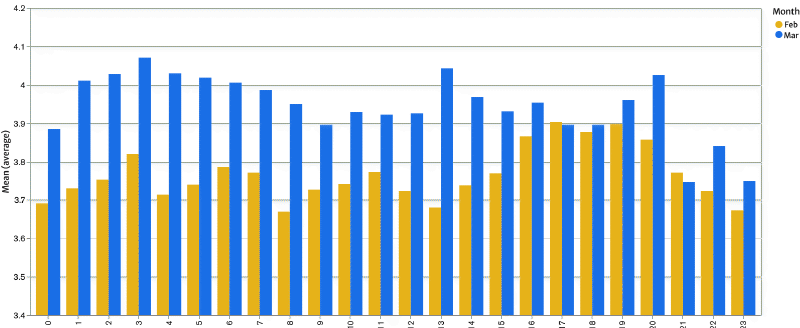
Regardless of hours with slower traffic or longer response times, actual users’ overall QoE has improved in March, which may come as a surprise. The network impact to video quality was small — the traffic speed was a notch above the video bitrates, that would be only a few Mbps even in Full HD — so other change might be the factors.
Note: Our QoE calculation uses various parameters retrieved during video playback, including bitrates, resolution, and pausing times due to buffer shortages. If the user’s bandwidth is enough, response times only affect the initial loading time as well as waiting times when they seek to any unbuffered part. The former won’t primarily affect the overall QoE. The latter also has a small impact on average QoE values even if the response times are getting longer, because there are only a small number of parameters measured multiple times during the playback.
When we see the playback resolution distributions, there are more high-resolution views in March than February.
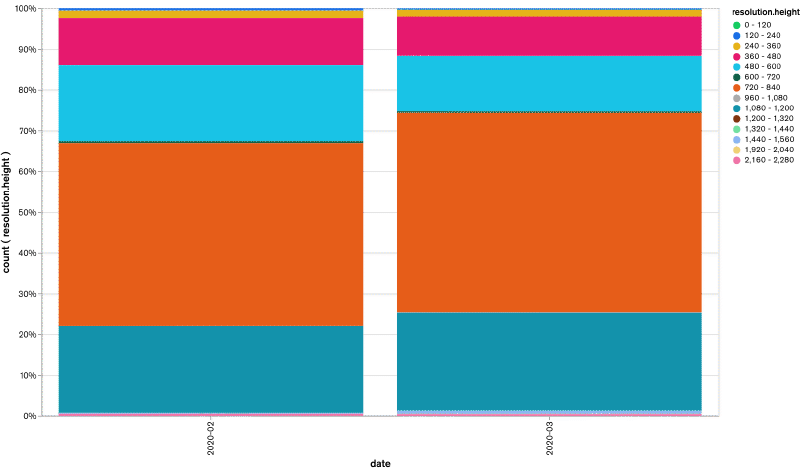
In general, as long as the traffic speed is satisfactory, a video player automatically selects a video file in the best resolution depending on the player’s dimension. The traffic speed wasn’t a problem, as explained above, so we think larger players would be a factor. The chances are, remote workers and students are watching more videos during the daytime, making the player maximized or fullscreen, instead of showing it smaller at the corner of the screen.
Change in the default resolution on YouTube
In Europe, EU officials asked content providers to control their traffic to evade network communication failures. Video streaming services like Netflix, Amazon Prime Video and YouTube agreed to lower their default video quality. Game vendors like Sony also slowed down their downloads.
Speaking of YouTube, it was announced on March 24 that the company would be gradually lowering the default video quality to the standard 480p resolution in the global markets, following Europe and North America. For that reason, people may believe that YouTube has already lowered the default resolution also in Japan to save the bandwidth.
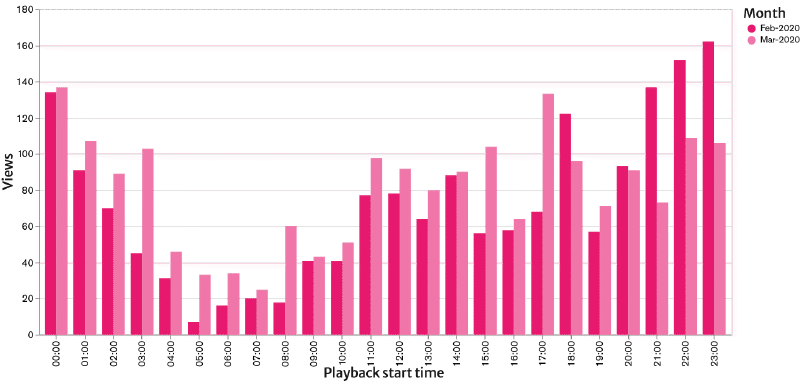
However, as of this writing in late April, YouTube has seemingly not implemented the measure in Japan yet. In fact, when we visit YouTube from a Japanese ISP to play videos, an HD resolution like 720p will be automatically selected just as before. We can also confirm this behavior with our statistics of data sent from Web VideoMark users, excluding our bots:
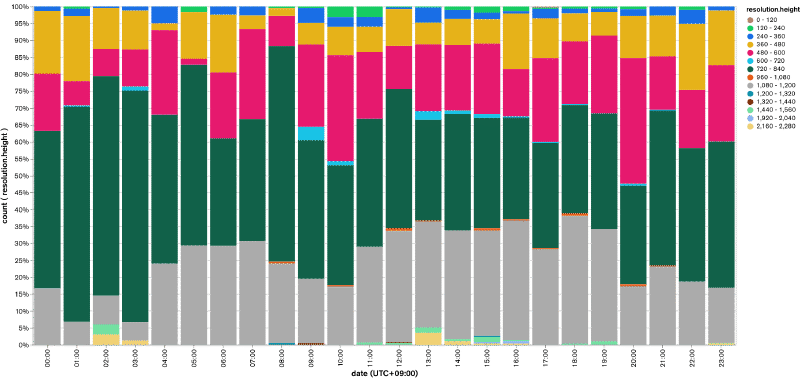
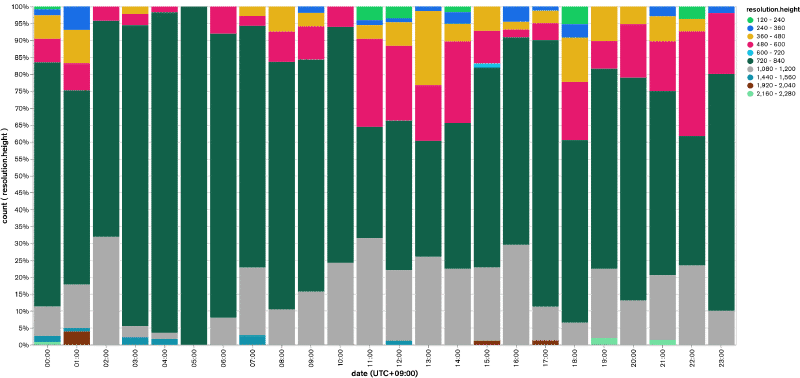
The playback resolution depends on the video file and player dimensions, and out statistics contain considerable variabilities due to a cross-tabling of 24-hour slots and 120px stops. Still, we can confirm that the standard (480p, pink in the chart) and lower resolutions are fewer after March 24, while the HD (720p, green) and higher resolutions are instead increasing. We couldn’t find any unusual behaviors like defaulting to the standard resolution only during the prime time.
Update: We focused on the change to 480p because YouTube’s announcement said they would globally apply the standard resolution. In Japan, instead, videos previously served in Full HD (1080p) might now be served in HD (720p) by default. These graphs may be suggesting the change: fewer 1080p (grey) and more HD (green).
We’ll continue reviewing this particular topic in April and beyond.
The population: where the stats come from
The analysis discussed in this post is based on log data collected by automated measuring devices (bots) and real people participating in our Web VideoMark project, who use YouTube or other streaming services with the browser extension or custom Android browser installed.
Here are the entire hourly views in February and March, the period subject to this report:
Our data collection is anonymous; we don’t ask our users to provide personal information such as gender, age or address, or connecting any external account. Therefore, we are not, and will never be, analyzing the data based on user attributes or making adjustments to match the general population distribution.
In general, each user’s approximate location, such as a province, and their ISP can be estimated with the GeoIP mechanism. GCP, MaxMind and others are providing a database for such purposes. Web VideoMark is also performing analysis using GeoIP, but we still don’t have enough user base and measuring samples that allow for cross-tabling. We could publish a geo-focused study after more people are getting involved.
Call for participation
For the Web VideoMark project, we are gathering data from volunteers opted into our online research, analyzing the network and QoE on actual services, and publishing the outcomes as open data. We’ll be posting analytics charts like ones shown in this article to the statistics page.
We don’t create an account for each participant or connect the users with existing external accounts. We also don’t ask any personally identifiable information, such as an address, name, gender, age or occupation. It means our log data doesn’t contain that kind of sensitiveness.
Furthermore, a randomly generated device ID is automatically changed at regular intervals, which the user can also reset manually in the options page. As an additional precaution, We filter out video logs with fewer views to prevent personal re-identification while analyzing the viewing history. This way, we make a maximum commitment to privacy before publishing our log data.
It also means we cannot analyze data using user attributes, but more participants will make sure our network analysis is consistent, accurate and comprehensive. We believe that publishing the QoE for actual users on actual services is useful, both from a macro and micro-perspective.
For instance, ISPs will be able to upgrade their facility by forecasting network jams and failures proactively. At the same time, it will be possible for end-users to compare ISPs and network carriers based on the quality of practical service usage. Once we have more data samples, we’ll make some comparisons public.
If you’re interested, please visit our project page, install an extension to one of the supported browsers including Chrome and Edge, and watch videos as usual. You don’t have to do anything else. It’s an online quality research anyone can easily participate, so join us today!
Besides, we can provide detailed data and briefing to network carriers, video service providers and researchers. Drop us a line if it sounds beneficial to you.